By Edward Mitchard, professor of global change mapping at the University of Edinburgh’s School of GeoSciences, and chief scientist of service provider Space Intelligence.
Recent claims around the effectiveness of rainforest carbon credits are being hotly debated right now. And rightly so. Companies have reportedly paid over $1 billion for these credits, and they are being used to offset ‘real’ emissions. So, if they’re not genuine, that’s a massive problem for climate action.
The stubbornly high rate of global tropical deforestation is a tragedy of our age: by 2021, we destroyed around 23% of the tropical forest that remained in the year 2000 [1]. This is despite repeated commitments from countries and multi-national groups to halt deforestation, most recently with the Sustainable Development Goals (SDGs), which aimed to stop deforestation by 2020. This has simply not happened. Deforestation continued at the same pace in 2021, 2020, and multiples years prior.
[1] https://forobs.jrc.ec.europa.eu/TMF/index.php – Published paper C. Vancutsem, F. Achard, J.-F. Pekel, G. Vieilledent, S. Carboni, D. Simonetti, J. Gallego, L.E.O.C. Aragão, R. Nasi. Long-term (1990-2019) monitoring of forest cover changes in the humid tropics. Science Advances 2021
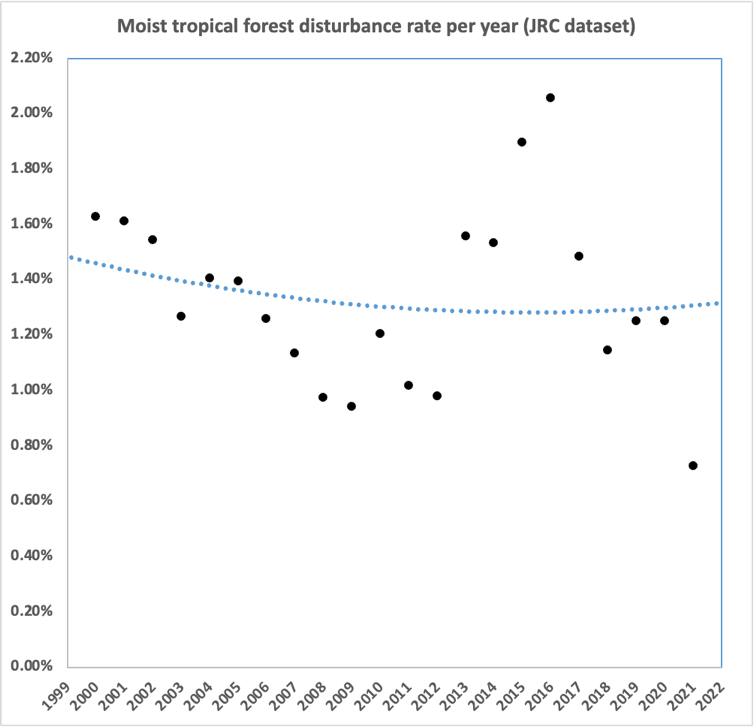
Annual moist tropical forest disturbance. Note annual variability partly due to cloud cover and data availability. Long term should be reliable. Data from https://forobs.jrc.ec.europa.eu/TMF/
Reducing Emissions from Deforestation and forest Degradation (REDD+) projects, mostly certified under the Verified Carbon Standard (VCS) run by Verra, provide a mechanism for individuals and companies in the developed world to conserve tropical forests, and the precious biodiversity and carbon they store.
Carbon offsets are not a panacea, and will not stop climate change: but they are a way for companies and individuals who have unavoidable emissions to take that carbon back out of the atmosphere, and do some good to the world’s poorest people and most biodiverse forests while doing so.
I have visited some of these projects and talked to local communities across Peru, Uganda, and Tanzania. I have seen first-hand how they bring money and opportunities to some of the world’s poorest people, and genuinely stop the pressure on the forests. I have also been involved in the tortuous process of gaining approval for some of these projects. This involves hundreds of pages of documents, thousands of trees measured, endless questions from the project auditors, and the use of sophistic satellite datasets.
With this in mind, I was surprised to read the Guardian’s recent story claiming that over 90% of rainforest carbon credits are ineffective, so I set out to better understand the three studies behind the reporting.
On first glance the studies appear rigorous: two have gone through peer review, and the third has a similar author group and methods to the others. However, my immediate thought is that they do not cover many projects. There are 104 Verra validated REDD+ projects, with many more in development, but these studies only considered 40. It’s therefore clear that scientists did not write the headline that “more than 90% of rainforest carbon credits … are worthless”, given fewer than half of the projects have been studied.
As an expert in making maps of deforestation for REDD+ projects, the next thing I went to check was what satellite data and analysis methods the authors used to map deforestation. To my disappointment, I discovered they all used pre-published, large-scale datasets reliant on NASA Landsat satellite data: the recent (non-peer reviewed) study led by Thales West used the Global Forest Change dataset (which ‘powers’ Global Forest Watch), the older Brazil-focused West study uses a Brazilian Space Agency (INPE)-derived dataset called PRODES, and the study led by Guizar-Coutiño uses a product focused on moist tropical forest produced by the EU’s JRC (used to make the figure above).
While each has their strengths, it’s well known that broad datasets are not greatly accurate at the individual project level. REDD+ projects need granular, locally calibrated data and so projects demand expert internal teams or the use of external companies. Such maps often make use of Synthetic Aperture Radar data or other, optical satellite datasets that are a higher resolution than Landsat. Using any of these international datasets would not normally satisfy a validator following Verra’s strict requirements for its VCS methodology.
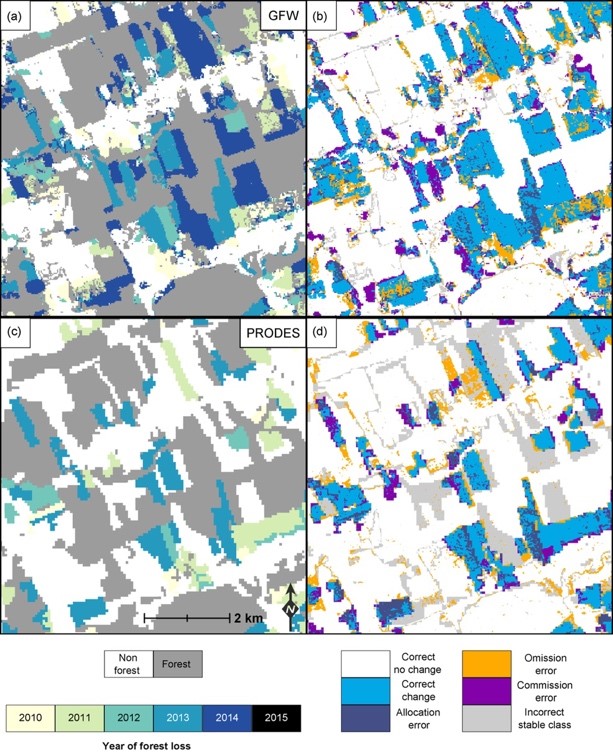
As an example, one of my PhD students and I showed in a peer reviewed study how two of these datasets (Global Forest Watch and PRODES) underestimated forest loss in Brazil [2]:
[2] https://iopscience.iop.org/article/10.1088/1748-9326/aa7e1e/meta
Other factors can interfere with measurement too. Cloudy and dry forest areas perform especially poorly, such as those in the Global Forest Change dataset being used by West [3].
[3] https://www.nature.com/articles/s41467-018-05386-z
GFW’s dataset only uses optical satellite data, which is fine over tropical forest areas, but over drier areas it can be confused by grasses, grass fires, and trees losing their leaves. Synthetic Aperture Radar data, which is harder to analyse, can overcome complications with cloudy conditions and provide far more accurate results. This wasn’t used in any of the studies, but many REDD+ projects use such radar data for this exact reason.
The two West papers then use a technique called ‘synthetic controls’: this compares the projects’ progress against randomly selected areas outside the project area that hold some similarity. If REDD+ projects are working well then, when using this method, the deforestation rates in these control sites should match the project ‘baselines’, while the rates in the outside area should be much lower. A project’s baseline is set at the outset of the project; it is the predicted deforestation rate over the next ten years if the project did not happen.
While this sounds like a sensible approach, it is very difficult to find suitable control areas to make these comparisons and I see that the authors excluded projects where they could not find good matches, despite these being some of the best performing projects (e.g. the Southern Cardamom project in Cambodia, which has few matching sites precisely because it is effectively protecting a unique large block of forest with no equivalent elsewhere in Cambodia). REDD+ projects must go through rigorous processes that follow a strict methodology to select their control areas. These are further chosen based on local conditions and research, which were also excluded, not just analysis of global datasets.
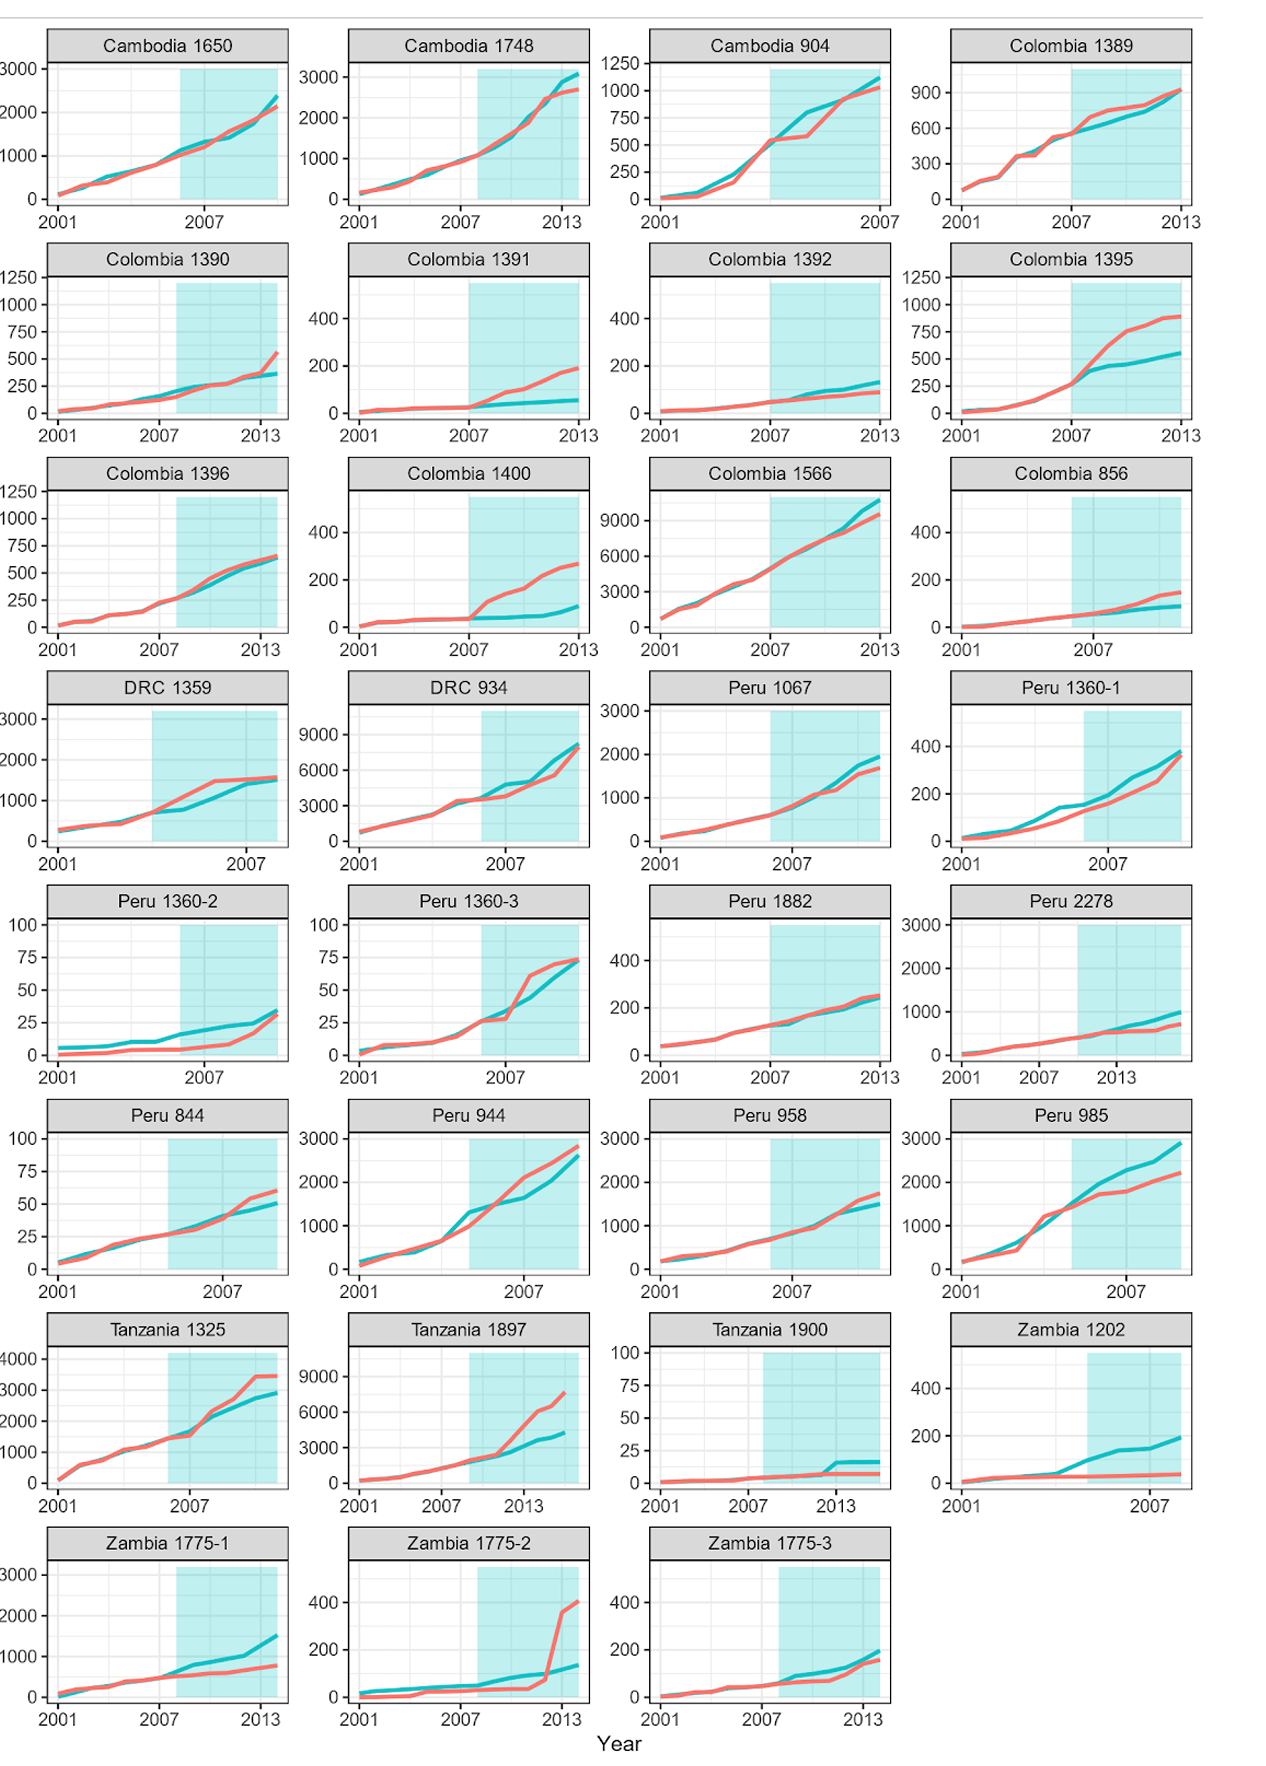
All three papers test their methods of selecting control areas by comparing sites before the REDD+ projects start. This is an important comparison to do, as it tests whether the method works in principle. If the method worked, these lines would all match perfectly across the periods being studied: but in all three studies they do not in every case. As the figure below taken from the West (2023) paper shows, there are big deviations in many cases. For example, even though there are no active REDD+ projects at the time chosen, their analysis suggests project 1395 in Colombia, and projects 1897 and 1775-2 in Zambia have performed very poorly; in other cases the error is the other way. This means their method of selecting matching areas is poor. Nonetheless they use this method to compare the REDD+ projects after they start.
Red lines are the deforestation rates in the project sites, blue in the control areas, figure S2 from this paper [4]. They are trained (i.e. matches chosen) on the white regions of the graphs, then tested on the blue regions.
[4] https://arxiv.org/abs/2301.03354
The importance of reporting REDD+ projects accurately cannot be understated when the challenge we’re facing is so immense: the conservation of tropical forests is integral to stopping the worst effects of climate change. This work is highly complex, and it requires continuous scrutiny and improvement (which is ongoing, e.g. see Verra’s activity here), but blanket analysis and flawed reporting risk us losing sight of what we know is working. Put simply, no other mechanism currently exists to finance forest conservation at this scale, and we’re running out of time.
Edward Mitchard is Professor of Global Change Mapping at the University of Edinburgh’s School of GeoSciences, and co-founder and chief scientist of Space Intelligence, a company that provides satellite-based maps to nature-based solutions projects globally.
Any opinions published in this commentary reflect the views of the author(s) and not of Carbon Pulse.


