


Global traded carbon volumes fell 19% in 2015 to 6.2 billion tonnes of CO2e but the overall value of the markets rose 9% to €48.4 billion ($52.8 billion) due to higher per unit prices, analysts at Thomson Reuters Point Carbon said.
Volumes fell mainly due to a 29% drop in Europe as EU ETS speculators exited the market due to reduced volatility despite a slight increase in auction volume, the analysts wrote in an annual report. The value of EU market dipped 8%.
The EU ETS remained the dominant market, accounting for 80% of global volumes and 77% of the total value of all carbon markets, despite rapid growth in North America.
Markets on the other side of the Atlantic grew 121% in volume and 220% in value, mainly due to the inclusion of transport fuels in California’s WCI market, which also saw a higher turnover of futures trading.
The analysts expect only a slight rise in volume in 2016 as activity in the large Chinese and South Korean markets to remain modest, but that the value of global markets will gain by a quarter.
The report includes a breakdown of activity in all major trading regions and an outlook for 2016-2018.
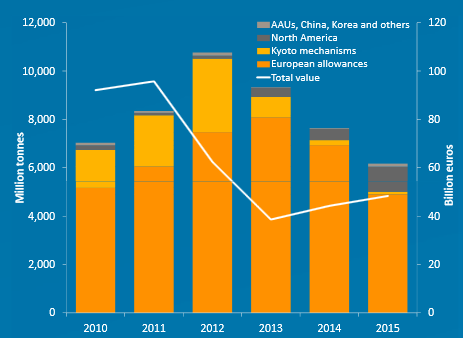
World Carbon Markets 2010-2015. Total value, volumes by segment. Source: Thomson Reuters
EUROPE
2015 marked the second year of the EU’s Backloading programme to withhold a total 900 million tonnes worth of allowances from government auctions, with 300 million held back compared to 400 million a year earlier. This left 636 million available to be sold in 2015.
This slight increase in primary volume was outweighed by a sharp fall in secondary market activity. Exchange-based trade dropped 32% to 3.9 billion tonnes, while OTC volume slipped 37% year-on-year.
Average front-year carbon prices rose from €7.70 in 2015, up from €6 in 2014 due to Backloadng and traders anticipating future tightness due to lawmakers passing the MSR reform to further curb EUA supply from 2019.
The analysts said the rise was only partially limited by falling power prices, whereby German benchmark prices fell to 12-year lows as more renewable capacity came online, limiting the appetite of utilities to sell electricity forwards and buy the resulting carbon.
“European lawmakers have proved their willingness to intervene to curb the accumulated oversupply of emission allowances. This ends a period of regulatory uncertainty, and one effect of this is a sharp drop in price volatility”, says Anders Nordeng, senior emission markets analyst at Point Carbon and lead author of the report.
EUA prices fluctuated wildly in the first half of 2015 as lawmakers struggled to pass both Backloading and the MSR. While prices stabilised somewhat in the second half, the analysts expect volatility to continue as forthcoming post-2020 reforms are more focused on how the share of allowances is distributed rather than the units being withheld altogether.
“We expect only modest growth in EUA transactions over the next three years. In 2016, we expect a volume of traded allowance around 5.3 billion tonnes, 7% up from 2015,” the report said.
This would roughly maintain, through to 2018, the ratio of traded volume to the annual ETS cap, which in 2015 was 3.4. That figure rose steadily from 1.6 in 2008 to a peak of 5.1 in 2014.
NORTH AMERICA
“The inclusion of fuel emissions increased California’s emission coverage from 165 Mt to 403 Mt”, said Tom Marcello, senior analyst of North American carbon markets at Point Carbon, flagging the region’s biggest development in 2015.
He said another reason for the strong growth was high demand for future vintages, combined with a high turnover rate in the secondary market, resulting in an almost two-fold increase in annual trade in the WCI and RGGI markets.
The report found offset trade to represent a marginal segment, with 19 million tonnes traded in the WCI market in 2015.
The analysts predict WCI volume to continue to rise over the next three years, despite relatively flat auction volume, as more 2019-vintage units contracts become available and Ontario launches its scheme in 2017 to join the California-Quebec scheme in 2018.
ASIA-PACIFIC
Meanwhile, trading volumes remain modest in the Chinese pilot markets and represented around 1% of global trade as regulators focus more on getting companies to comply than in stimulating trade.
This could be set to change in 2017, when China plans to introduce its national ETS to cover 4 billion tonnes of emissions, more than double the EU cap.
Until then, the analysts expect volumes in the regional pilot schemes to be flat as participants await policy updates on the national market.
Activity was also minimal in the South Korean scheme, which launched last year but suffered from a dearth of trade due to industries protesting a shortfall in free allowance allocations.
The analysts expect the market to come to life ahead of the end-June compliance deadline for 2015 emissions, but that this will only amount to around 11 million tonnes, or 2% of the 2015 allocation.
By Ben Garside – ben@carbon-pulse.com